Suppose you need to add a new feature to an existing and relatively complex module, inside you will find already declared several local variables such as external dependencies, and aliases for paths of particularly lengthy objects.
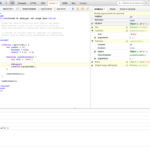
The approach that I use when I have to explore a new component or flow is to set a breakpoint at the desired point and then look at the role of the available elements in that context. Particularly useful to me is the watch expression panel that allows me to check if any given variables changes as side-effect of the execution of certain functions.
During one of my exploratory sessions I thought I’d stop in the still empty function that had to be called in response to an event and then start to analyze the situation from within, but I noticed that many elements of the upper context were not available.
Closure, scope and local variables
One of the basic concepts with which you are immediately faced when learning JavaScript is the demonization of the use of global scope and how the use of closure with local variables declared within functions called externally are the salvation to avoid the terrible namespace conflict or Clash of Vars™.

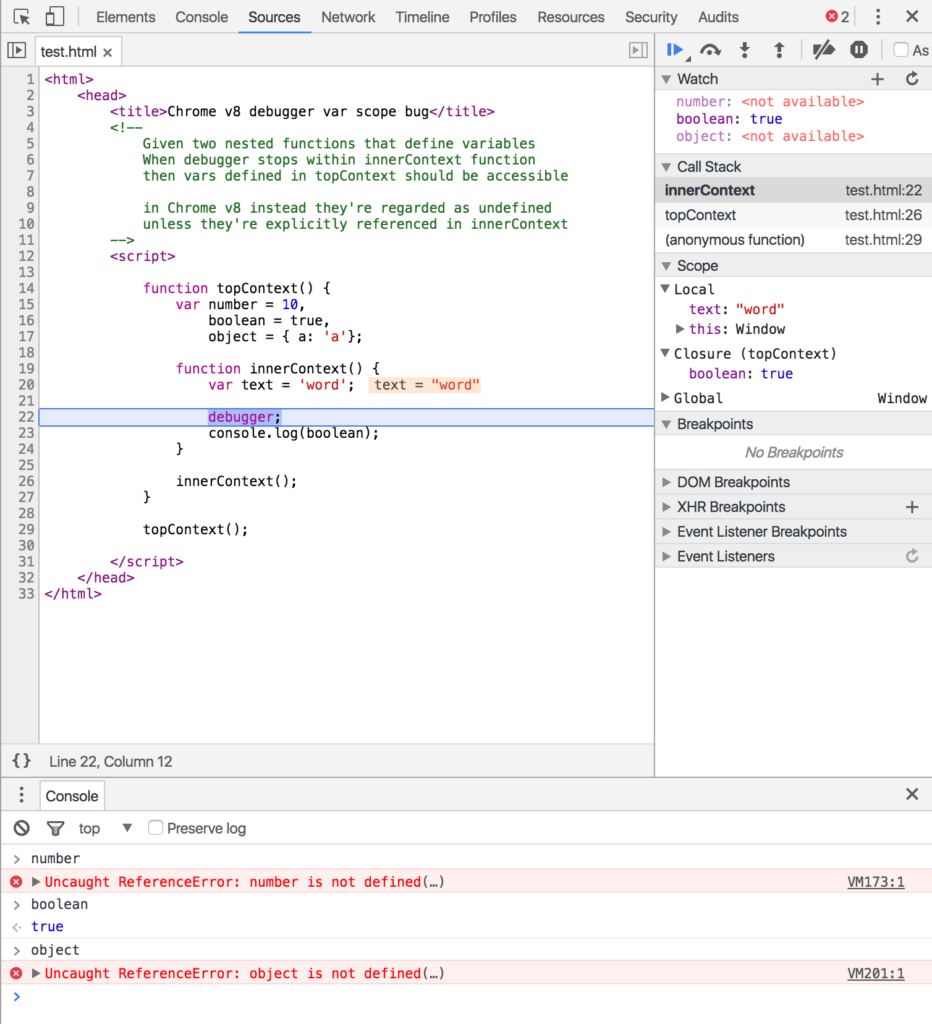
A fundamental aspect of the closure mechanism is that higher contexts do not have access to variables declared in the nested ones, but the inner ones can back access variables of all upper contexts in the stack, up to the global scope.
This behavior is respected by all JavaScript interpreters at runtime, but not during the debugging process, the exception is the V8 engine, used both in Chrome and in the latest versions of Opera.
It’s a memory optimization
The ratio behind this choice in the V8 engine is: if none of the contexts below does refer a specific variable then it’s useless to allocate memory for storing a reference that will never be used. Clearly this has advantages in terms of run-time execution speed once the code is “finalized” and only needs to be executed by the browser, but it’s rather counterintuitive to the developer that faces an inconsistency between what the language prescribes and what the browser does.
For this reason it was first opened in 2014 Issue 3491 to highlight how this inconsistency becomes in fact an obstacle in various situations where a developer is debugging code that he didn’t create from scratch, but unfortunately with little success as the ticket was closed without being resolved in 2015.
To add to the potential confusion is the fact that only in case of presence of the command eval the engine actually allocates each upper stack variable regardless that it is referenced or not in the body of the inner function, because in case of eval anything can happen, however, the variable although visible by the ” Scope” panel it will not be available to the developer in the browser terminal.
![]()
What about the other browsers?
Should this behavior become a blocking issue while trying to fix a bug you can turn safely to the competitors, FireFox and Safari, where the JavaScript code is executed as per the ECMAScript specification without any surprises, WYSIWYG style.